
_1.webp)


This is an analysis of school exclusion and suspensions data published this week by the Department for Education.
Despite a marginal decrease in annual school exclusion rates, the latest figures show that rates remain higher than pre-pandemic standards for both boys and girls.
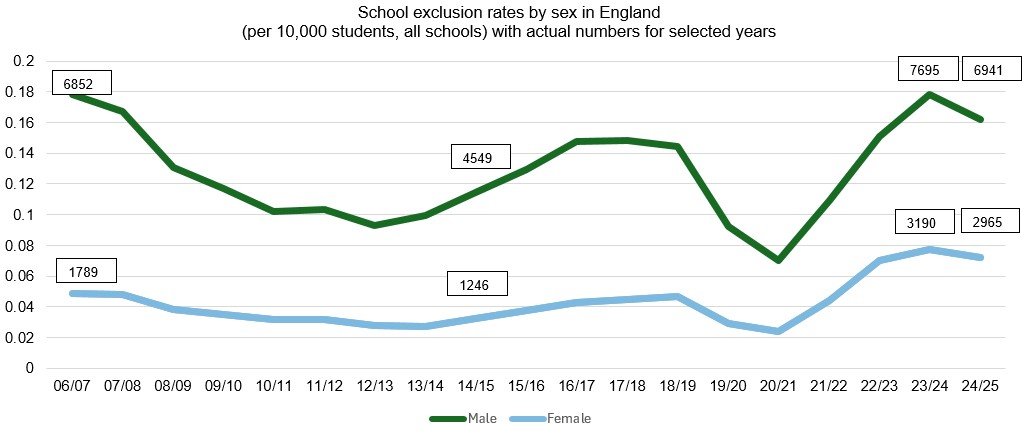
In 2024/25, permanent exclusion rates for boys were 0.162 per 10,000 students. By contrast, just 10 years earlier, this rate was 0.114, showing an increase of over 40%.
In real-term numbers, this saw 6,941 boys face permanent exclusion in 2024/5. In 2014/15, 4,549 boys were permanently excluded, meaning annual numbers have increased by over2,300.
The rates of permanent exclusions for girls in the same years were much lower. In 2024/25, permanent exclusion rates for girls were 0.072 per 10,000. In 2014/5, they were 0.033.
In real term numbers, this saw 2,965 girls face permanent exclusion in 2024/25 - less than half that of boys. In 2014/5, this number was 1,246.
This overall trend shows an alarming increase in school exclusions over the past 10 years. Whilst the number of girls being permanently excluded has increased at a higher rate (2.3x) than the number of boys being excluded (1.5 X), boys’ exclusions continue to be double those of girls. Overall exclusion rates are significantly higher than 10 years ago, and the marginal annual decrease in exclusions should not be used to ignore the overall and long-term trend.
The impact of so many boys being excluded from school will also have a negative impact on youth crime, the male NEET population and their overall life chances.
.jpg)