

Trigger warning: The content in this document contains discussions and references to suicide. If you find this material distressing, please do not read. Please contact organisations such as the Samaritan or CALM.
Last week, the Office for National Statistics issued its latest suicide statistics for England and Wales (1981-2025) – they make for grim reading. In this snapshot, the statistics combine England and Wales (and a small number of non-residents) rates (unless stated). All rates are per 100,000 of the relevant population.
These figures gendered patterns across age, place, income, method and marital status. It is regrettable that figures on ethnicity still do not seem to be available. This snapshot looks at five in particular.
In summary:
- The male suicide rate continue to plateau post-pandemic (17.5 per 100,000 in 2025, 17.6 in 2024 and 17.4 in 2023) and continue to be at higher rates than the start of the century (17.2)
- 75% of all suicides continue to be male.
- The current middle-aged male suicide rate (23.8) is not just the highest this century (17.2 in 2000), it is the highest since records began (22.5 in 1981).
- Suicide rates in London continue to fall across the century but suicide rates in the top three areas (North East, South West and Yorkshire and Humber) are higher. There is a growing regional divide.
- Suicide rates for married middle-aged men are three to four times lower than those middle-aged men who are single, divorced or widowed. This strongly suggests marriage seems to be a protective factor against male suicide.
Note: A pdf of this article is available.
(1) Age over Time
Figure 1: Suicide Rates per 100,000 in England and Wales - 1981 to 2025 (selected rates/numbers in brackets)
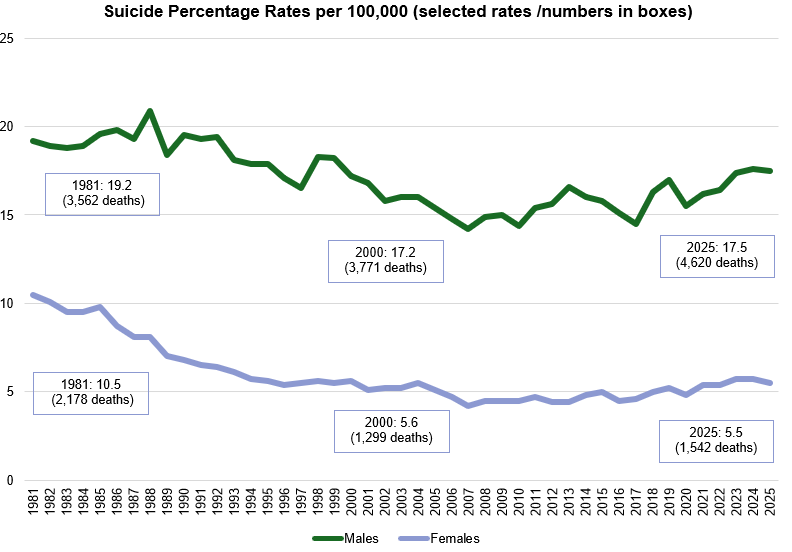
Figure 1 shows a number of patterns:
- The male suicide rates continue to plateau post-pandemic (17.5 per 1000,000 in 2025, 17.6 in 2024 and 17.4 in 2023) and continues to be at higher rates than the start of the century (17.2). Current suicide prevention strategies are not working.
- Men continue to make up 75% (three in every four) suicides.
- The male suicide numbers in England and Wales remain between 12 and 13 per day (12.6).
- Almost 100,000 men have died by suicide this century (99,875).
- Since “records began” in 1981, the suicide rate for women has fallen by 48% and for men, just 9%.
It is important to caveat the long-term trend data based on a change in the standard of proof made in 2018 (read here)
(2) Male Suicide Rates (65 and under categories)
Figure 2: Male suicide Rates per 100,000 in England and Wales - 1981 to 2025 (under 65 ranges)
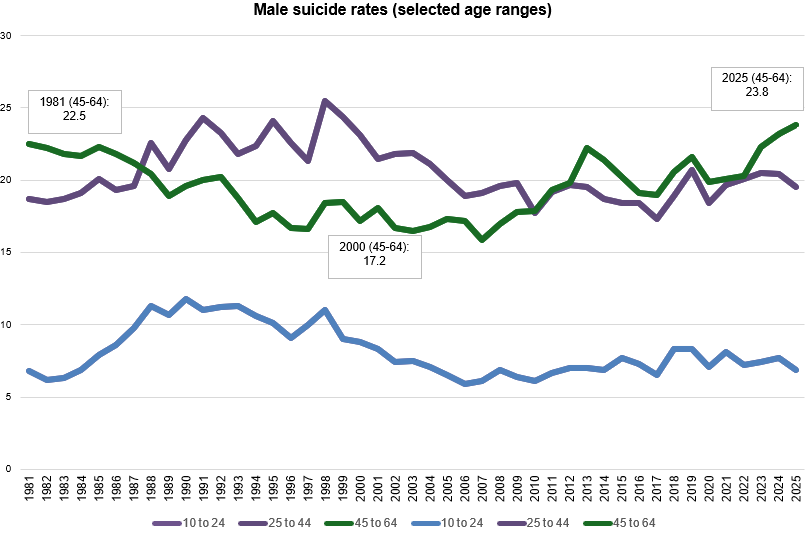
Taking a selection of different ages (ONS categories), the data shows that:
- The 10-25 male suicide rate has broadly plateaued.
- Prevalence rates for middle-aged men (45-64) overtook those for younger men (25-44) between 2010-2012 and this change hascontinued.
- The current middle-aged male suicide rate (23.8) is not just the highest this century (17.2 in 2000), it is the highest since records began (22.5 in 1981
(3) English Regions
Figure 3: Highest and lowest rates in English regions

Looking at the top three English regions for suicide (North East, South West and Yorkshire, and, Humberside) and the lowest (London), the data shows:
- The male suicide rate in London has fallen across the century, whilst it is higher in the other three regions.
- The regional suicide gap is increasing. In 2021 it was up to 2.9 percentage points between these four areas, now it is 11.6 percentage points. The suicide rate in London is nearly half that of the North East.
- In the South West, there was a sharp increase in the male suicide rate between 2024 (17.8) and 2025 (22.1).
Table 1: “League Table” of English Regions between 2025 and 2019 (pre-pandemic)
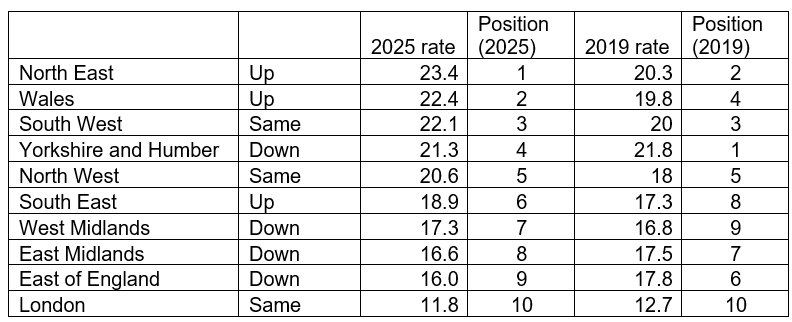
This league table shows a broad trend from the period immediately before the pandemic. The North West, Wales and South West have the three highest male suicide rates and these rates have increased after the pandemic. However, there have been clear falls in the Midlands, the East of England and London.
(4) Marital Status
Table 2: Relationship status by gender when dying by suicide (selected ages)
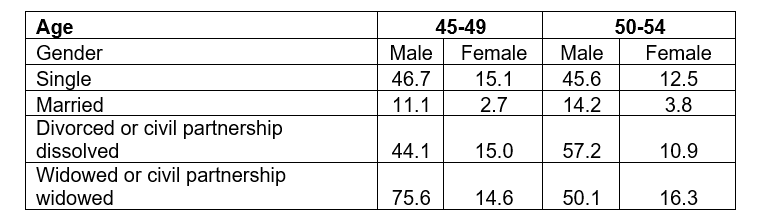
Taking a snapshot at two periods where suicide rates the highest, it shows married men aged 45-49 are four times less likely to die by suicide than those who are single or divorced. It is seven times higher for those men who are widowed. This suggests that marriage is a protective factor.
Similar patterns are found in the 50-54 age group with a notable increase in that age group for those who are divorced. A similar pattern is in place for women too.
In research on male suicide, relationship breakdown and bereavement, especially when unexpected, are key life event triggers for suicide and suicide ideation.
(5) Method of Suicide
Table 3: Method of suicide by sex

The ONS lists suicide by method and show nearly 60% of men die by suicide through hanging, strangulation and suffocation. Nearly half of women die in this manner too. Women are more likely to die by suicide through poisoning than men and men are more likely to die through other more outwardly violent methods.
Please do contact a range of organisations for support: Samaritans, CALM, Papyrus and James’ Place.
And please check in on your mates – see why in this video: Brighton and Hove Albion FC
Note: Rates are expressed in numbers per 100,000 which is what the ONS use