
_1.webp)


A level results come out yesterday, and as usual, they do not tell a singular story.
On one hand, the percentage of male entries which achieved A*-A at A level is marginally higher than female students, for the second year running, bucking the long term trend. This year, 28.9% of entries by male students were A*-A, compared to 27.9% of female entries.
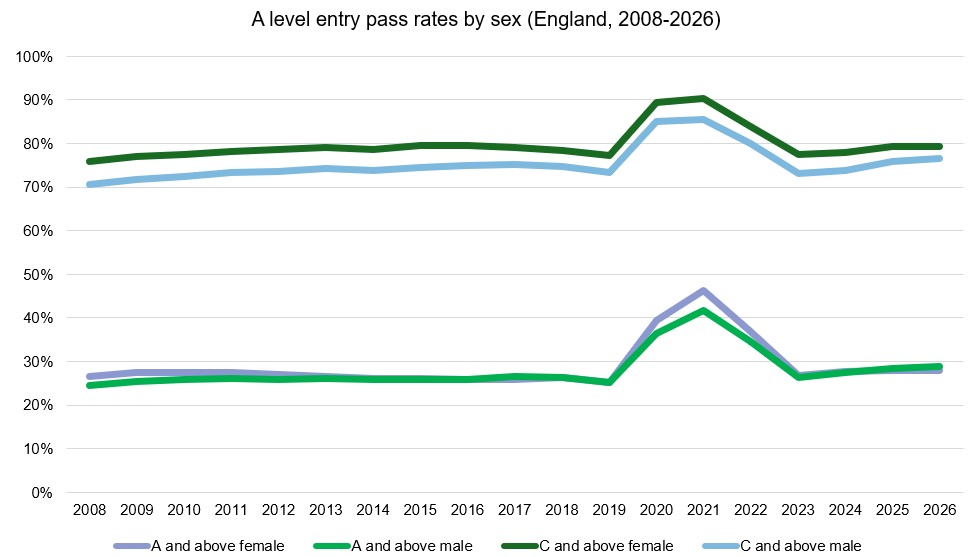
Graph 1 showing attainment split at grade A and above and grade C and above by sex
Many papers have picked up on this story. The Guardian ran the article ‘Boys outperform girls for top grades again’ and the Telegraph ran the article ‘Boys take record lead over girls in A level results’. And whilst this rise is worth noting, these articles are not reflective of what is really occurring.
This year, 59,340 fewer A levels were taken by male students. This is a long standing pattern, and means that in raw numbers, significantly fewer males were awarded A*-A at A level this year- 12,673 fewer.
Different theses exist as to why fewer boys take A levels. Some argue boys tend to academically self-filter at an early age than girls; others point to the greater proportion of men choosing vocation routes at 16.However, regardless of the reason, the outcome is that 26,000 fewer 18-year-old boys across England have been accepted into university this year.
Another story that has gone untold is the higher saturation of boys achieving the lower grades at A level. As Graph 1 shows, female students have achieved grades C or above in a greater proportion than male students every year, since 2008. This year, 79.4% of female entries achieved grade C or above, compared to 76.6% of male entries. 6.7% of A levels taken by male students were awarded an E, compared to 5.5% of female students, and 13.8%of male entries were awarded a D, compared to 12.9% of female entries. The percentage point difference between males and females’ entries receiving grades C or above (2.8%) is greater than the difference between males and females’ entries getting A and above grades (1%) yet has received significantly less traction. And given that a C is often the entry grade needed to attend university, the greater percentage of boys failing to achieve this grade or higher challenges the narrative put forward today by many mainstream papers.
Graph 2 below shows the attainment gaps over time for C and above, and, A and above. The spike in 2020 and 2021 was when A levels were assessed by teachers rather than through examinations.
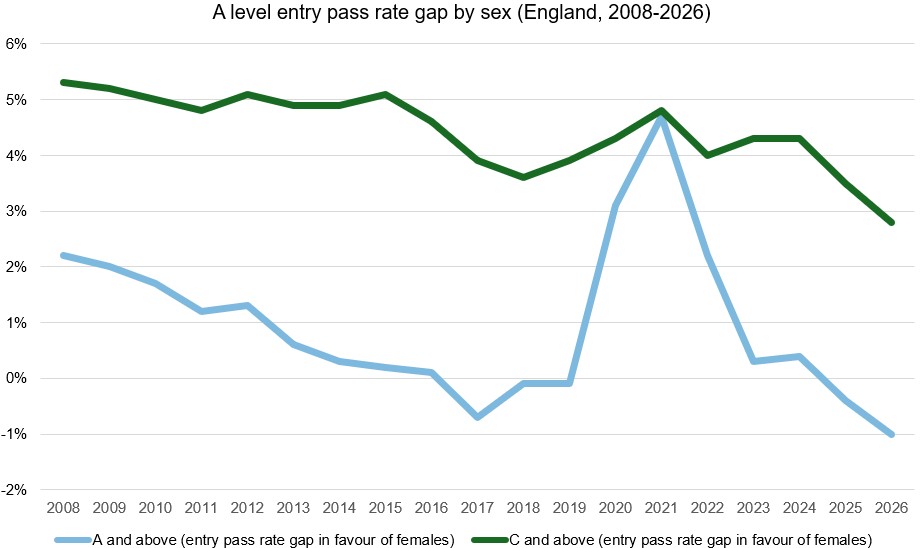
Graph 2 showing percentage point entry rate attainment differences at grade A and grade C by sex
Subject data also reveals interesting patterns. This year ,the A level subject in which the greatest number of male entries achieved a grade of A or above was Mathematics (including statistics); for female students, it was in Psychology. Both Mathematics and Psychology appeared in the5 most popular A levels this year, and have stark gender splits- 63.1% of students taking Maths this year were male and 75.4% of students taking Psychology were female. This data poses significant questions. Why are some subjects more or less appealing for boys? Is this the gender split of a subject’s entrants at all correlated to its overall popularity? And, what are the consequences of these subject gender splits overall?
Overall, CPRMB welcomes the high percentage of students achieving impressive results today, and notes that a greater proportion of male students taking A levels sit in this cohort. Yet, CPRMB advises caution in using a single percentage point in an attempt to tell the full story. Doing so obscures the high saturation of male students in the lower grade brackets; misses the 59,000 fewer A levels taken by boys than girls, and does not accurately reflect the multiple stories that results day should unearth.